A few times in my Kubernetes clusters, I’ve encountered situations where some process consumes all the CPU or RAM which starves other services for critical services. For example, in one situation, Longhorn consumed all CPU and RAM and my pi-hole running on the same machine stopped being able to process DNS requests. Other issues have included having to shut down one of my worker nodes and the other nodes not having enough capacity to take on pods and important pods not getting scheduled or even a mistake when I changed the pod selector labels and Kubernetes just spawned thousands of pods.
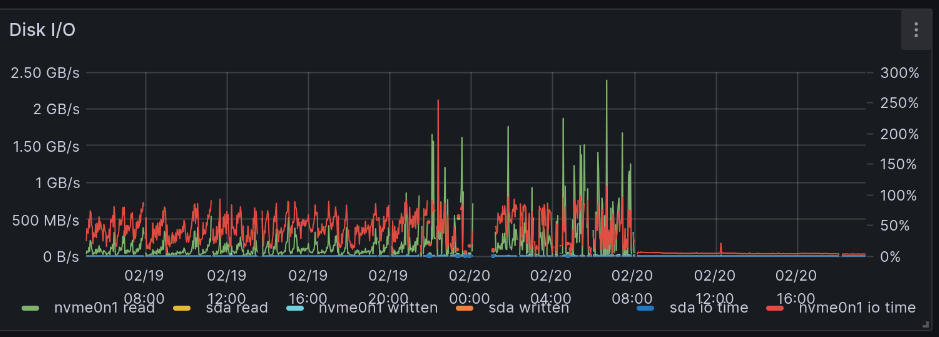
The graph below shows Disk I/O of a node with excessive disk writes because the OS is swapping RAM out to desk and back.
My home lab servers are now running what I consider to be “business critical” services and I don’t want those to be impacted. Kubernetes has several different knobs we can use to improve this such as leveraging Linux’s cgroups to ensure that specific pods get a certain amount of CPU and RAM. It also supports prioritization, so that certain pods get scheduled and others get evicted if there isn’t enough space.
Or even lately, I’ve been hitting the max pod limit of 110 pods on my single-node cluster. Not everything is important and I want to make sure certain cron jobs always run even if I’m running some low-priority jobs. Turns out it is possible to be running 110 different pods.
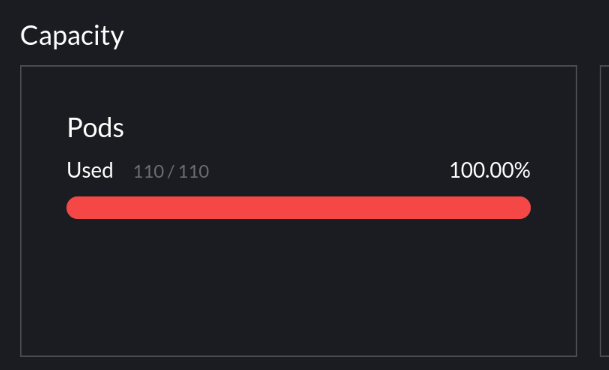
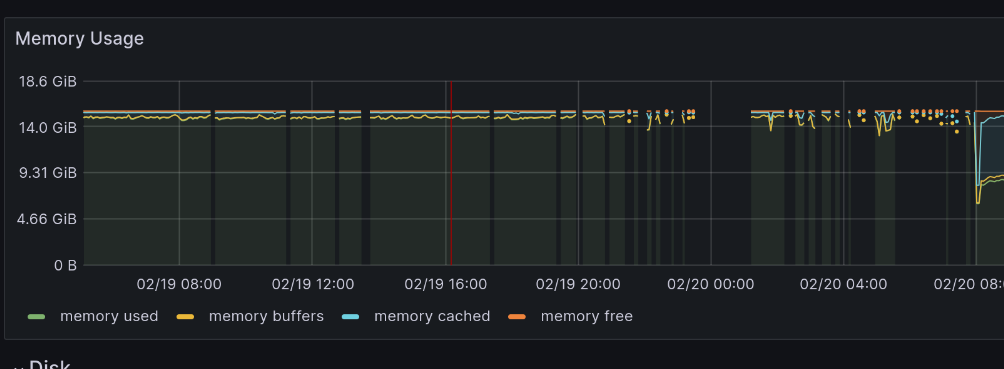
Image Below: A sad worker node valiantly trying to keep operating without enough RAM. The breaks in metrics is when Prometheus is unable to scrape metrics because it didn’t get a chance to run.
In this post, I’m going to walk through the steps that I took to improve reliability by using Kubernetes’ resource management and scheduling features. My clusters run on a limited number of hosts (only one node for my home and three nodes for my public cluster) and do not automatically scale up or down nodes, so I need to ensure that everything fits onto the clusters without starving any resource.
The problem
Each of the incidents that I alluded to earlier were caused by me trying to schedule too many services for the given nodes. Exceeding the total RAM space causes the kernel to start swapping memory out to disk which slows down services as memory pages have to keep getting swapped in and out and additionally prevents the kernel from caching files in RAM.
In this chart, the OS has run out of RAM and Prometheus is unable to get time on the CPU to scrape metrics. Before Prometheus can run any code, it has to wait for the Kernel to swap in pages that it needed. This was bad because it was starving Pi-hole’s DNS server for CPU time and prevented Internet access.
Overscheduling the CPU with too much work means that there’s threads awaiting time on the CPU, but not enough cores. Like RAM swapping, this will increase latency of operations.
There are other ways to saturate a host like disk or network I/O, but I’ll focus on RAM and CPU because Kubernetes provides resource management for these two limits.
Resource requests and limits
The first thing is setting resource requests and optionally limits on workloads. A resource request states that a given container should only be allocated on a node if there’s enough un-reserved space. So a container that requests 4GB should not be allocated on a node with 8GB of RAM that already has 6GB of RAM dedicated to other workloads.
A limit states the maximum amount of a resource a given container should be allocated. Memory limits are given to the container so it knows how much it can allocate, though exceeding it will result in the container being killed. Software can be a little bit unpredictable in how it uses resources, it might spike up and settle back down faster than Prometheus can collect metrics, so be conservative in your limits.
If you don’t set a limit, then the container can use as much as it wants.
Can not setting a limit cause problems for other services?
Resource requests and limits use Linux cgroups under the hood which tells the Linux scheduler how much time and memory should be provided to a process or process group (a process group is a hierarchy of processes.) If you don’t use resource requests at all, then one process can use memory and push another process out of memory (unless it gets OOMKilled by the kernel.)
A memory request sets the memory.min cgroup setting which tells the Kernel to avoid reclaiming memory from this container until there’s no other process to recover RAM from. This means that the Kernel will generally scavenge RAM from other places before impacting the processes you really care about.
By default, Kubernetes also sets the memory.swap.max cgroup setting to 0 which prevents the Kernel from swapping memory pages out for the given container, however as in the example above, there’s still plenty of other pages that are necessary that aren’t directly in the container’s space, there’s a lot of system daemons, file caching, and other processes that are crucial for operation that could start swapping. However, this can be mitigated by reserving space for those processes directly.
So, not setting a limit can still cause issues, however setting requests gives you a lot of protection against over-scheduling until things get really bad.
Picking numbers
Memory
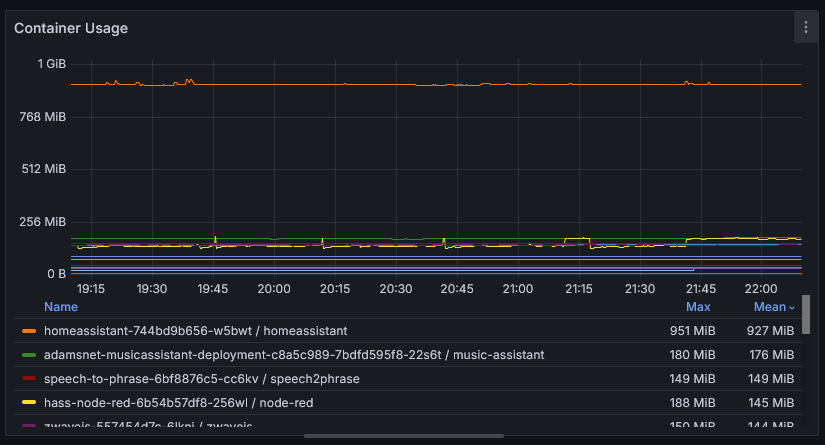
To pick my resource requests, I go to Prometheus after a service has been running for a bit of time and look at it’s RAM and CPU usage. For example, looking at the following graph, I’d say homeassistant should have 1GB for a request and the limit.
When picking these numbers, consider the workload. Does it have spiky operations where it pulls in a bunch of data, then clears it out later? Make sure to accommodate that usage. Does memory trend up? Maybe you’ve got a memory leak or maybe it’s just caching more. Many processes will adapt to memory limits and perform garbage collections more frequently (at the cost of more CPU usage) or just reduce it’s caching to adapt.
 Prometheus Query:
 container_memory_usage_bytes{container!="POD",container!=""}
CPU
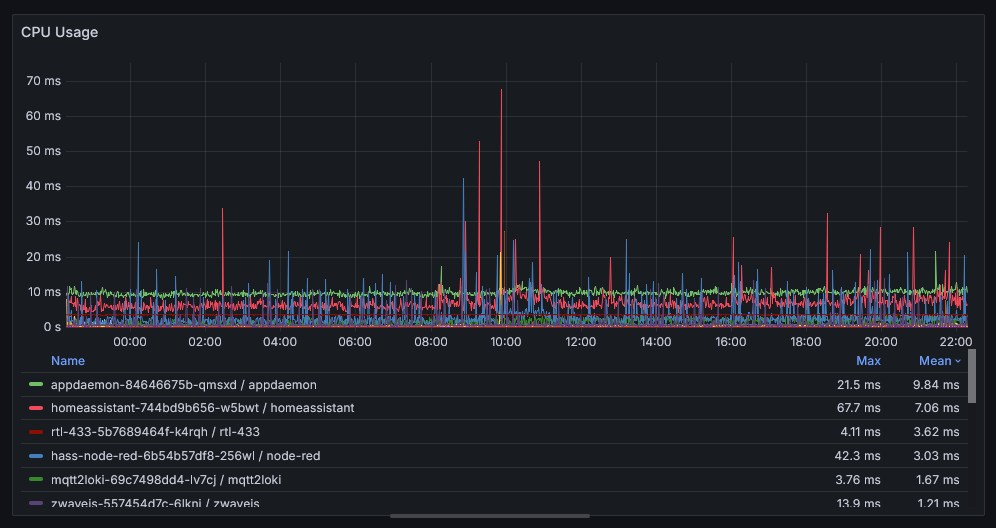
Let’s try to do the same thing with CPU. Starting with the below graph, I can see that homeassistant uses about 7ms of CPU per second and seems to peak at 68ms per second. It’s per second because irate averages the increase over the interval to get the per second rate.
 Prometheus Query:
 irate(container_cpu_usage_seconds_total{container!=""}[1m])
Setting a CPU request is safe because it defines the minimum amount of CPU time reserved for the process. It’s measured in number of CPUs, so a request of 1 reserves an entire core for the container, a request of 2 gives two cores, and a request of 256m gives 1/4 of a core. For this example, I went with resource.requests=256m so it shares a CPU core with other process.
However, there’s peril with setting a limit. As a turns out CPU utilization is misleading and tons of posts that say you should or shouldn’t use CPU limits.
CPU is trickier than memory because CPU usage in Prometheus is measured in milliseconds, but then averaged over seconds or minutes in graphs. So instead, if we change from irate to increase which does not average it and shows the pure increase from one minute to the next, it shows that we used an average of 540ms of CPU time per minute.
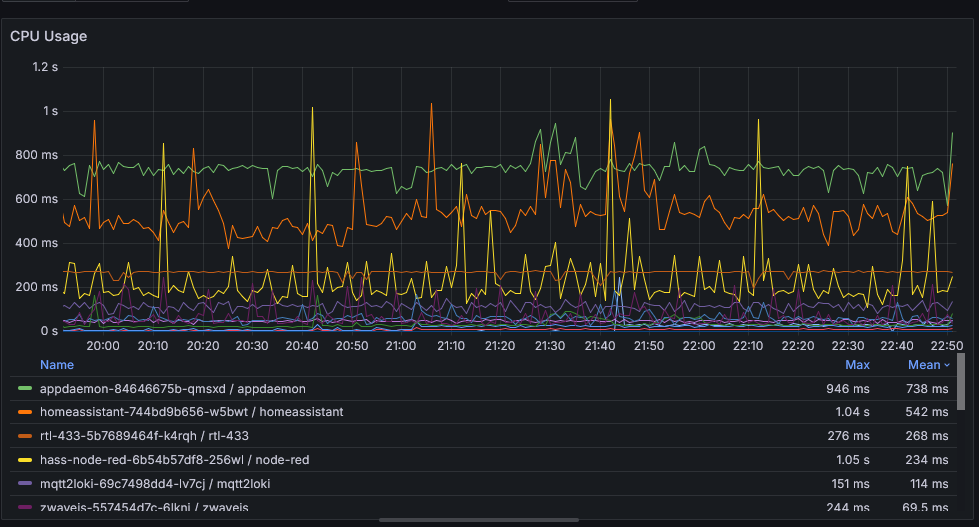
If that were to execute all in a 1 second block, then setting a limit could mean the process is stuck waiting for CPU time when there is idle time available. If you’re not sure how the process behaves, it’s probably safer not to set a limit.
The biggest benefit with setting a limit is if you have the limits equal to requests, then Kubernetes will mark the pod with the guaranteed QoS meaning that it’s always the last pods to get evicted by Kubernetes or to face the wrath of the kernel.
Defining them in YAML
Resource requests and limits are easy to set in YAML:
| |
Defining resource requests and limits gives the Kubernetes scheduler information on how heavy workloads are and ensures that there’s space to schedule them, but at this point it’s just first-come-first-serve. The first pod scheduled wins.
Kubectl command to review current settings
This command is useful for viewing all pods and their assigned requests:
| |
Priority Classes
Priority classes then give the Kubernetes scheduler information to know which pods have to be running and which ones aren’t. It depends on the information provided by resource requests and limits to know when it has to prioritize. Official documentation can be found here. Prioritization ensures that my high-priority services, such as DNS, always gets scheduled and my lower-priority services, like my Blender distributed rendering service (Blendfarm) don’t kill my DNS.
Priority classes rank the services into most important to least important. Normally, I can run every single workload I care about, but defining these priority classes ensure that when I do some development work and spin up something to test, my scheduled jobs still run.
Identifying services
The first step is to identify all the services that are critical for functioning. I know that I need pi-hole for my Internet DNS traffic, Home Assistant and my smart home services, and Postgres for data storage.
But those services have dependencies themselves too. For example, pi-hole won’t start without:
- Calico and Multus to setup networking and expose the service via BGP to my network
- Longhorn to mount the data and config volumes
- CoreDNS to handle DNS resolution for queries to my internal services
Other soft dependencies include:
- ingress-nginx to be able to access the pi-hole UI
- Vouch-proxy to handle access control to the UI
If I capture those dependency in a dependency graph, I end up a diagram like this just for pi-hole.

I start with pi-hole as critical for my network, then go through each dependency and ensure that it’s the same priority or higher priority.
My List
Starting from the lowest level, this is the list I came up with:
- System
- containerd
- ssh
- k3s
- Basic stuff
- Calico (networking CNI)
- CoreDNS
- Storage
- Longhorn
- local-path-storage
- Management (system-cluster-critical)
- cattle-cluster-agent - Needed so I can use the Rancher UI to manage my cluster
- network-critical
- pi-hole
- metal-lb
Without everything above, I would just consider the entire home network non-functional and would quickly have frustrated family members and guests. That doesn’t mean I can’t run the next list. Things would still be broken, but at least I can get online to figure out how to fix the other issues.
- smarthome-critical
- Home Assistant
- ZWaveJS
- MQTT
- Other Smart Home services
- Databases (Postgres, InfluxDB)
- Internal DNS Stuff (external-dns + etcd)
- ingress-nginx
My computer runs a lot of the automations in my house. Without them, I’d be sad, but still my light switches would work. Those services should still get priority over anything else.
- smarthome-important
- Auth (Vouch Proxy)
- Voice Assistants for Smart Home (whisper, piper)
The smarthome-important category of services are still noticeable when they’re offline, but at least things work without them.
- other-important - Things that I want to run instead of my random test services, but are not as important as things that actively get used by me on a daily basis
- Scheduled jobs
That led me to this diagram showing the dependencies of services and to think it’s not all of my workloads that I have running.

Creating the priority classes
Kubernetes comes with a few default classes and Longhorn also brings it’s own, so I have to create my own for the lower priorities:
| |
Creating a new one is easy and looks like this. Pick a value that’s smaller than the higher priority. Kubernetes convention seems to use multiples of 100_000_000 to give space to put your own priorities in.
| |
Making changes
Now that I’ve identified categories of services based on how important they, it’s time to start tagging and updating workloads and processes. I’m starting with the OS and working my way up.
The Operating System
Kubernetes doesn’t know how much space to reserve for the operating system itself. Think the kernel, sshd, systemd, and if you’re like me and use my server for a TV, a desktop environment. The kubelet provides a parameter --system-reserved to tell Kubernetes to ignore some of the resources when scheduling nodes.
I’ve got a 16 core CPU, so I’ll reserve two cores for the host OS and 4GB of RAM. I’m using K3s managed by Rancher, so the setting is controlled by the Cluster resource:
| |
Rancher Management
Rancher System Agent
The Rancher system agent is used when you deploy a RKE2 or K3s cluster using the Rancher UI, like I do. It needs some CPU time reserved so that any changes to the cluster itself, like version upgrades, etc.. Management daemons should always get some reserved resources to ensure that they can make corrective actions, if necessary. For the system agent, I use systemd’s CPUShares property to give it some time.
| |
| |
Rancher Cluster Agent
Next, the Rancher Cluster Agent is used to proxy Kubernetes calls from the Rancher UI to the downstream cluster. Without this, I’d be unable to browse and make corrective actions. Another management component, but this one runs as a Kubernetes Pod. By default, it’s marked as system-cluster-critical which is the second highest priority. No need to change the priority class, just give it some resources:
| |
Calico
Now we’re into Kubernetes workloads that need to be updated using the priorityClassName field on the PodSpec.
Calico provides networking for all pods. Without it, pods wouldn’t start. This reserves some CPU and memory for them:
| |
Postgres
I deploy Postgres using CloudNativePG which uses a custom resource to provision my Postgres database. Resource requests and priorities can be set like so:
| |
Other workloads
Anything else is updated directly on the PodSpec
| |
Now it’s just a matter of working through every single workload including Deployments, DaemonSets, CronJobs, and StatefulSets to mark them with resources and priorities. You can pick whichever order you want, either most important or by the biggest consumer.
Conclusion
There’s a lot that goes into resource management in a Kubernetes cluster when running many different services. Kubernetes depends on the values for priorities and resource requests you provide on the services to decide how to schedule and run pods.
- Resource requests tell Kubernetes whether there’s space to fit a given workload on the cluster.
- Resource limits define the maximum size of a workload and prevent it from exceeding that.
- Priority classes are used when the resource requests exceed total node space